MOCA Console.
> The MOCA Console allows us to view information about an active MOCA Server Environment.
> Before 2010.1 the MOCA Console was part of the client GUI.
> For version 2010.1 and later of MOCA, the MOCA Console is accessed via a web browser.
MOCA Console - Sessions.
> This screen is for monitoring active sessions running on theMOCA server.
> Under the "Actions" drop down on the upper left corner of the screen.
• The server can be restarted.
• A session thread can be interrupted for the selected row.
> A refresh button is also available.
MOCA Console – Sessions - Current Sessions Grid
Field Name. Description
Session The name of this session.
Thread Id The thread id that this session is executing session is executing on in the MOCA server.
Status The status of this session. one of "Inactive", "In Engine", "Executing
Java", "Executing C", "Executing .NET", "Executing COM",
"Executing SQL" or "Executing Script".
Last Command Time
The date/time of the last execution of a command. If this server thread is associated with a client session this is the date/time of the last command request, otherwise it is the date/time of the last initiated command
Last Script Time The date/time of the last execution of a script.
Last SQL Time The date/time of the last execution of a SQL statement.
Connected IP Address
The IP address of the client that established this session.
Tracing Whether this session currently has tracing enabled
MOCA Console – Sessions – Execution Tab
Field Name. And Description
Current Command Path
The current command path of this executing session. This will be the Command path that is currently executing if available.
Last Command
The last execution of a command. If a client request is the last
command requested. If it is a server thread then is the last initiated
command.
Last Script
The last execution of a script.
Last SQL
The last execution of a SQL statement.
MOCA Console – Sessions – Server Thread Tab
Field Name and Description
Blocked Count
The number of times that this server thread has blocked to enter or reenter a monitor.
Blocked Time
The accumulated elapsed time in milliseconds that this server thread has blocked to enter
or reenter a monitor. A value of -1 indicates that thread contention monitoring is disabled.
In Native
A flag indicating if this server thread is currently executing native code using JNI.
Suspended
A flag indicating if this server thread is currently suspended.
Thread Id
The unique id for this server thread.
Thread Name
The name for this server thread as defined by the servlet container.
Thread State
The current state of this server thread.
Waited Count
The number of times that this server thread waited has been in the WAITING or
TIMED_WAITING state.
Waited Time
The accumulated elapsed time in milliseconds that this server thread has been in the
WAITING or TIMED_WAITING state. A value of -1 indicates that thread contention
monitoring is disabled.
MOCA Console – Sessions – Call Stack Tab
> The Call Stack tab provides a view of the call stack associated with the selected server thread.
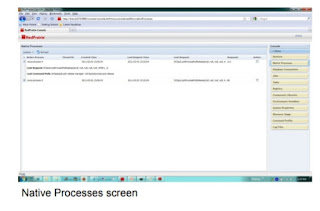
MOCA Console – Native Processes
• This screen is for monitoring Native Processes runnning on the MOCA Server.
• Native Processes are processes that are written in C or COM that run outside the main server processes.
> Under the "Actions" drop down on the upper left corner of the screen.
• A native process can be stopped.
> A refresh button is also available.

MOCA Console – Native Processes - Native Processes Grid
Field Name and Description
Native Process
The identifier for this native process. Identifiers are named moca-process-x where x is an incrementing number.
Thread Id
The server thread id associated with this native process. If this value
is empty the native process is idle and not currently associated with
a server thread.
Created Time
The date/time that this native process was created.
Last Request Time
The date/time of the last request made to this native process.
Last Request
The component library name and function/method name of the last
request made to this native process.
Request Count
The total number of requests made to this native process.
Active
A flag indicating if this native process is currently active.
Last Request
The last request is the same as in the grid, but allows for wrapping if
the function/method name and arguments are too long to fit within
its column in the grid.
Last Command Path
This is the command path up to and including the execution of the
last native function.
MOCA Console
• MOCA Console – Database Connections.
• This screen is for monitoring the active database connections on the server.
• The only available action on this screen is refresh.
MOCA Console – Database Connections – Database connections Grid
Field Name and Description
Connection
The identifier for this database connection. Identifiers are named
environment_name-node_id-x where node_id is the value of the server.node-id registry key if it is set and x is an incrementing number.
Thread Id
The server thread id associated with this database connection. If
this value is empty the database connection is not currently associated with a server thread.
Created Time
The date/time that this native process was created.
Last SQL Time
The date/time of the last SQL statement executed on this database
connection.
Last SQL
The last SQL statement executed on this database connection.
Executions
The total number of SQL statements executed on this database connection.
MOCA Console – Database Connections – Expanded
Row in Database Connections Grid
Field Name and Description
Last SQL
The last SQL statement is the same as in the grid, but allows for wrapping if the SQL statement text is too long to fit within its column In the grid.
Last Command Path
This is the command path up to and including the execution of the
last SQL execution.
MOCA Console – Jobs
• This screen is for monitoring jobs running on the MOCA Server.
> Under the "Actions" drop down on the upper left corner of the screen.
• Scheduling for a job can be stopped for the selected row.
• Scheduling for a job can be started for the selected row.
> If scheduling for a job is stopped, this will only stop new jobs from being scheduled. Any currently executing copies of that job will continue to run until they are finished.
> Note that this action is not the same as "Disabling" the job on the Job Maintenance screen.
> A refresh button is also available.
MOCA Console – Jobs – Jobs Grid
Field Name and Description
Scheduled Name
A check box indicating if this job is currently being scheduled by the Job Manager.
Type
The type of job. Jobs can be timer-based or schedule-based.
Command
The command that should be executed by the Job Manager when
running this job.
Interval
For timer-based jobs, the number of seconds the Job Manager Should wait from the last time the job was started before starting a new instance of it.
Schedule
For schedule-based jobs, the Quartz-style schedule for this job.
Enabled
A flag indicating if this job should initially be scheduled by the Job Manager when the MOCA server starts.
Overlap
A flag indicating if the Job Manager should run a new instance of This job if a previous instance of it is still running.
MOCA Console – Jobs – Expanded Row in Jobs Grid
Field Name and Description
Job Id
A unique identifier for this job.
Start Delay
The number of seconds that the Job Manager should wait before running this job for the first time if it is enabled.
Log File
An optional pathname of the log file to write output to.
Trace Level
An optional MOCA trace level to use when running this job. This is usually used in conjunction with the Log File.
Command
The command that should be executed by the Job Manager when
running this job.
MOCA Console – Tasks
• This screen is for monitoring tasks running on the MOCA Server.
> Under the "Actions" drop down on the upper left corner of the screen.
• A task can be stopped for the selected row.
• A task can be started for the selected row.
> Note that a task stopped here will not be restarted, even if it has be set to auto-restart in Task Maintenance.
> A refresh button is also available.
MOCA Console – Tasks – Tasks Grid
Field Name and Description
Running
A check box indicating if this task is currently running.
Name
The name of this task.
Type
The type of task. Tasks can be thread-based or process-based or a
daemon.
Command
The class name and arguments for thread-based tasks. The executable pathname and arguments for process-based tasks and daemons.
Auto Start
A flag indicating if this task is automatically started by the Task
Manager when the MOCA server starts.
Restart
A flag indicating if this task should be restarted by the Task Manager
if it exits prematurely.
MOCA Console – Tasks – Expanded Row in Tasks Grid
Field Name and Description
Task Id
A unique identifier for this task.
Start Delay
The number of seconds that the Task Manager should wait before
starting this task for the first time if it is set to auto start.
Start In
The directory this task is started in; its current directory
Log File
An optional pathname of the log file to write output to.
Command/Class Name
The class name and arguments for thread-based tasks. The executable pathname and arguments for process-based tasks and daemons.
MOCA Console – Registry.
• This screen simply shows the MOCA registry as it is loaded into memory
MOCA Console – Component Libraries
.
• This screen shows the component libraries that the MOCA server has loaded.
MOCA Console – Component Libraries Grid
Field Name and Description
Component Library
The name of this component library.
Version
The version of this component library.
Java Package
The Java package name for component libraries containing Javacode.
C Library
The DLL or shared library name for component libraries containing C code.
.NET Namespace
The .NET namespace for component libraries containing managed code.
COM Prog Id
The COM program id for component libraries containing COM code.
Precedence
A number associated with the precedence (or sort sequence) of this component library. Higher numbers take precedence over lower numbers.
Licensed
A flag indicating if this component library is licensed
MOCA Console – Environment Variables.
• This screen simply shows the environment variables loaded into the MOCA server memory.
• Each row in the screen grid shows the variable name and the associated value.
MOCA Console – System Properties.
• This screen simply shows the Java system properties loaded into the MOCA server memory.
• Each row in the screen grid shows the property name and the associated value.
MOCA Console – Resource Usage.
• This screen simply shows summary information showing how much memory and how many sessions, native
processes and database connections are being used by The MOCA server.
• Information is displayed both graphically and with statistics.
• A refresh button is available.
MOCA Console – Resource Usage - Memory
Field Name and Description
Current Heap Used
The amount of memory currently being used by the MOCA server.This includes memory occupied by all objects including both reachable and unreachable objects.
Current Heap Size
The amount of memory guaranteed to be available for use by the
MOCA server. This number may change over time. The heap size will always be greater than or equal to the used memory. This is the equivalent of the "committed" memory that jconsole reports and "heap size" that jvisualvm reports.
Max Heap Size
The maximum amount of memory that can be used by the MOCA server for memory management. A memory allocation may fail if theMOCA server attempts to increase the used memory to be greater than the heap size, even if the amount used is less than or equal tomax. For example, this can occur when the system is low on virtual
memory.
MOCA Console – Resource Usage – Sessions
Field Name and Description
Current Sessions
The current number of sessions established with the MOCA server.
Peak Sessions
The peak number of simultaneous sessions that have been
established with the MOCA server since it was last started.
Max Sessions
The maximum number of simultaneous sessions that can been
established with the MOCA server at any one time. This value will match the server.session-max registry value.
MOCA Console – Resource Usage – Native Processes
Field Name and Description
Current Native Processes
The current number of native processes managed by the MOCA server
.
Peak Native Processes
The peak number of native processes that have been managed by
the MOCA server at any one time since it was last started.
Max Native Processes
The maximum number of native processes that can be managed by The MOCA server at any one time. This value will match the server.session-max registry value.
MOCA Console – Resource Usage – Database Connections
Field Name and Description
Current Database Connections
The current number of connections to the database server
established by the MOCA server.
Peak Database Connections
The peak number of connections to the database server that have been established by the MOCA server at any one time since it was
last started.
Max Database Connections
The maximum number of connections to the database server that
can be established by the MOCA server at any one time. This value will match the datbase.max-conn registry value.
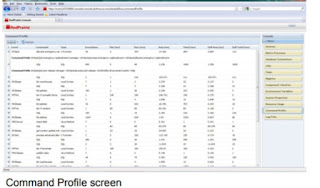
MOCA Console – Command Profile.
• This screen shows command profiling information. Command profiling is the statistics tracking the MOCA server performs for each executed MOCA command.
> Under the "Actions" drop down on the upper left corner of the screen.
• Command profiling information can be downloaded to an excel spreadsheet.
• Command profile information can be cleared which resets the statistics.
• A task can be started for the selected row.
• Summary information showing how much memory and how many
sessions, native processes and database connections are being used by the MOCA server.

MOCA Console – Command Profile – Command Profile Grid
Field Name and Description
Level
The component library this command executed at.
Command
The command name or "SQL" if this row is associated with the Execution of a SQL statement.
Type
The command type. One of "Local Syntax", "Java Method", "C Function", "Managed Method", "COM Method" or "SQL".
Executions
The number of times this command has been executed from this
command path.
Min
The minimum execution time of this command in milliseconds.
Max
The maximum execution time of this command in milliseconds.
Avg
The average execution time of this command in milliseconds.
Total
The total execution time of this command in milliseconds.
Self Avg
The average execution time of this command in milliseconds, minus
the time spent executing commands further down the command path.
Self Total
The total execution time of this command in milliseconds, minus the
time spent executing commands further down the command path
MOCA Console – Command Profile – expanded row in Command Profile Grid
Field Name and Description
Command Path
The command path that led to the execution of this command.
MOCA Console – Log Files
• This screen shows log file information without having to be on the server.
> Under the "Actions" drop down on the upper left corner of the screen.
• Log files can be downloaded for viewing.
> A refresh button is also available.
MOCA Console – Log Files – Log Files grid
Field Name and Description
Filename
The name of this file.
Last Modified
The date/time this file was last modified.
Size
The size, in bytes, of this file.


Comments
Post a Comment